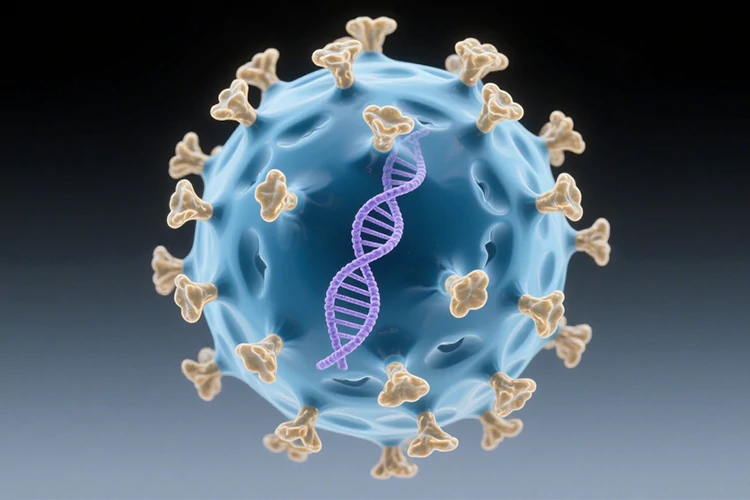
Breaking the 20 nm Barrier: Redefining Single-Particle Analysis.
Vertex electron microscopy-level resolution enables accurate detection of viral particle aggregation, setting a new industry standard for AAV product quality control.

Particle size range: 15 - 60 nm
Ultra-wide concentration detection range: 1010 - 1012 particles/mL
Accurate counting in just 2 - 3 minutes with 1 nm resolution.
Compatible sample types: AAV / small VLPs

Unparalleled Detection Performance
Particle size measurement precision comparable to electron microscopy
The NanoCoulterTM measures the average particle size and size distribution of polystyrene standard microspheres and other polydisperse samples,producing results that are fully consistent with SEM data, offering exceptionally high accuracy and precision.
Measure concentration with high accuracy and repeatability
Samples were diluted in a gradient, and the concentration detection data showed a good linear relationship, consistent with the theoretical concentration(R2 > 0.99). With 10 repeated tests, the coefficient of variation (CV) was less than 5%.
Related Cases
Latest Articles & News
AAVs are promising gene therapy vectors due to their small size and favorable safety profile. However, accurately characterizing these sub-50 nm particles remains a major technical challenge in the field.
Recently, NanoCoulter™ has gained growing recognition in exosome research, with multiple studies validating its analytical strengths. Below are highlights from several key publications.
In the fields of nanotechnology and materials science, particle size distribution (PSD) is a critical parameter that directly influences the performance and applicability of nanomaterials. Two of the most commonly used indicators to evaluate PSD are the Polydispersity Index (PDI) and the SPAN value. While often used interchangeably, these two metrics differ significantly in how they are calculated and interpreted. Understanding the distinction between PDI and SPAN is essential for accurate particle characterization.


