A high cost-performance instrument for measuring particle size and concentration.

Unparalleled Detection Performance
Electron Microscopy- Comparable Particle Size Determination
NanoCoulter™ measures both the particle size and size distribution of polydisperse samples, delivering EM-consistent results with exceptional accuracy and precision.


Measure Concentration with High Accuracy and Repeatability
Samples were serially diluted, and the concentration detection data demonstrated a strong linear correlation with the theoretical concentration (R² > 0.999). Across 10 repeated measurements, the coefficient of variation (CV) was less than 5%.


Related Cases
MISEV Recommends RPS for EV Characterization
“RPS measurements do have very high concordance with TEM data.” —MISEV 2023
RPS technology, a non-optical method, well suited for orthogonal validating against TEM and flow cytometry. NanoCoulter™ offers accurate size distribution analysis with a defined LOD (50nm) and a wide concentration range (5×10⁷-2×10¹¹ particles/mL), making it indispensable for EV research.”


Investigation of EV Isolation Methods
Exosomes have complex origins and often require multiple isolation steps to obtain relatively pure exosomes. Different isolation methods can significant impact on the particle size and concentration of exosomes. The NanoCoulter™ enables rapid and accurate assessment of the advantages and disadvantages of different purification methods.

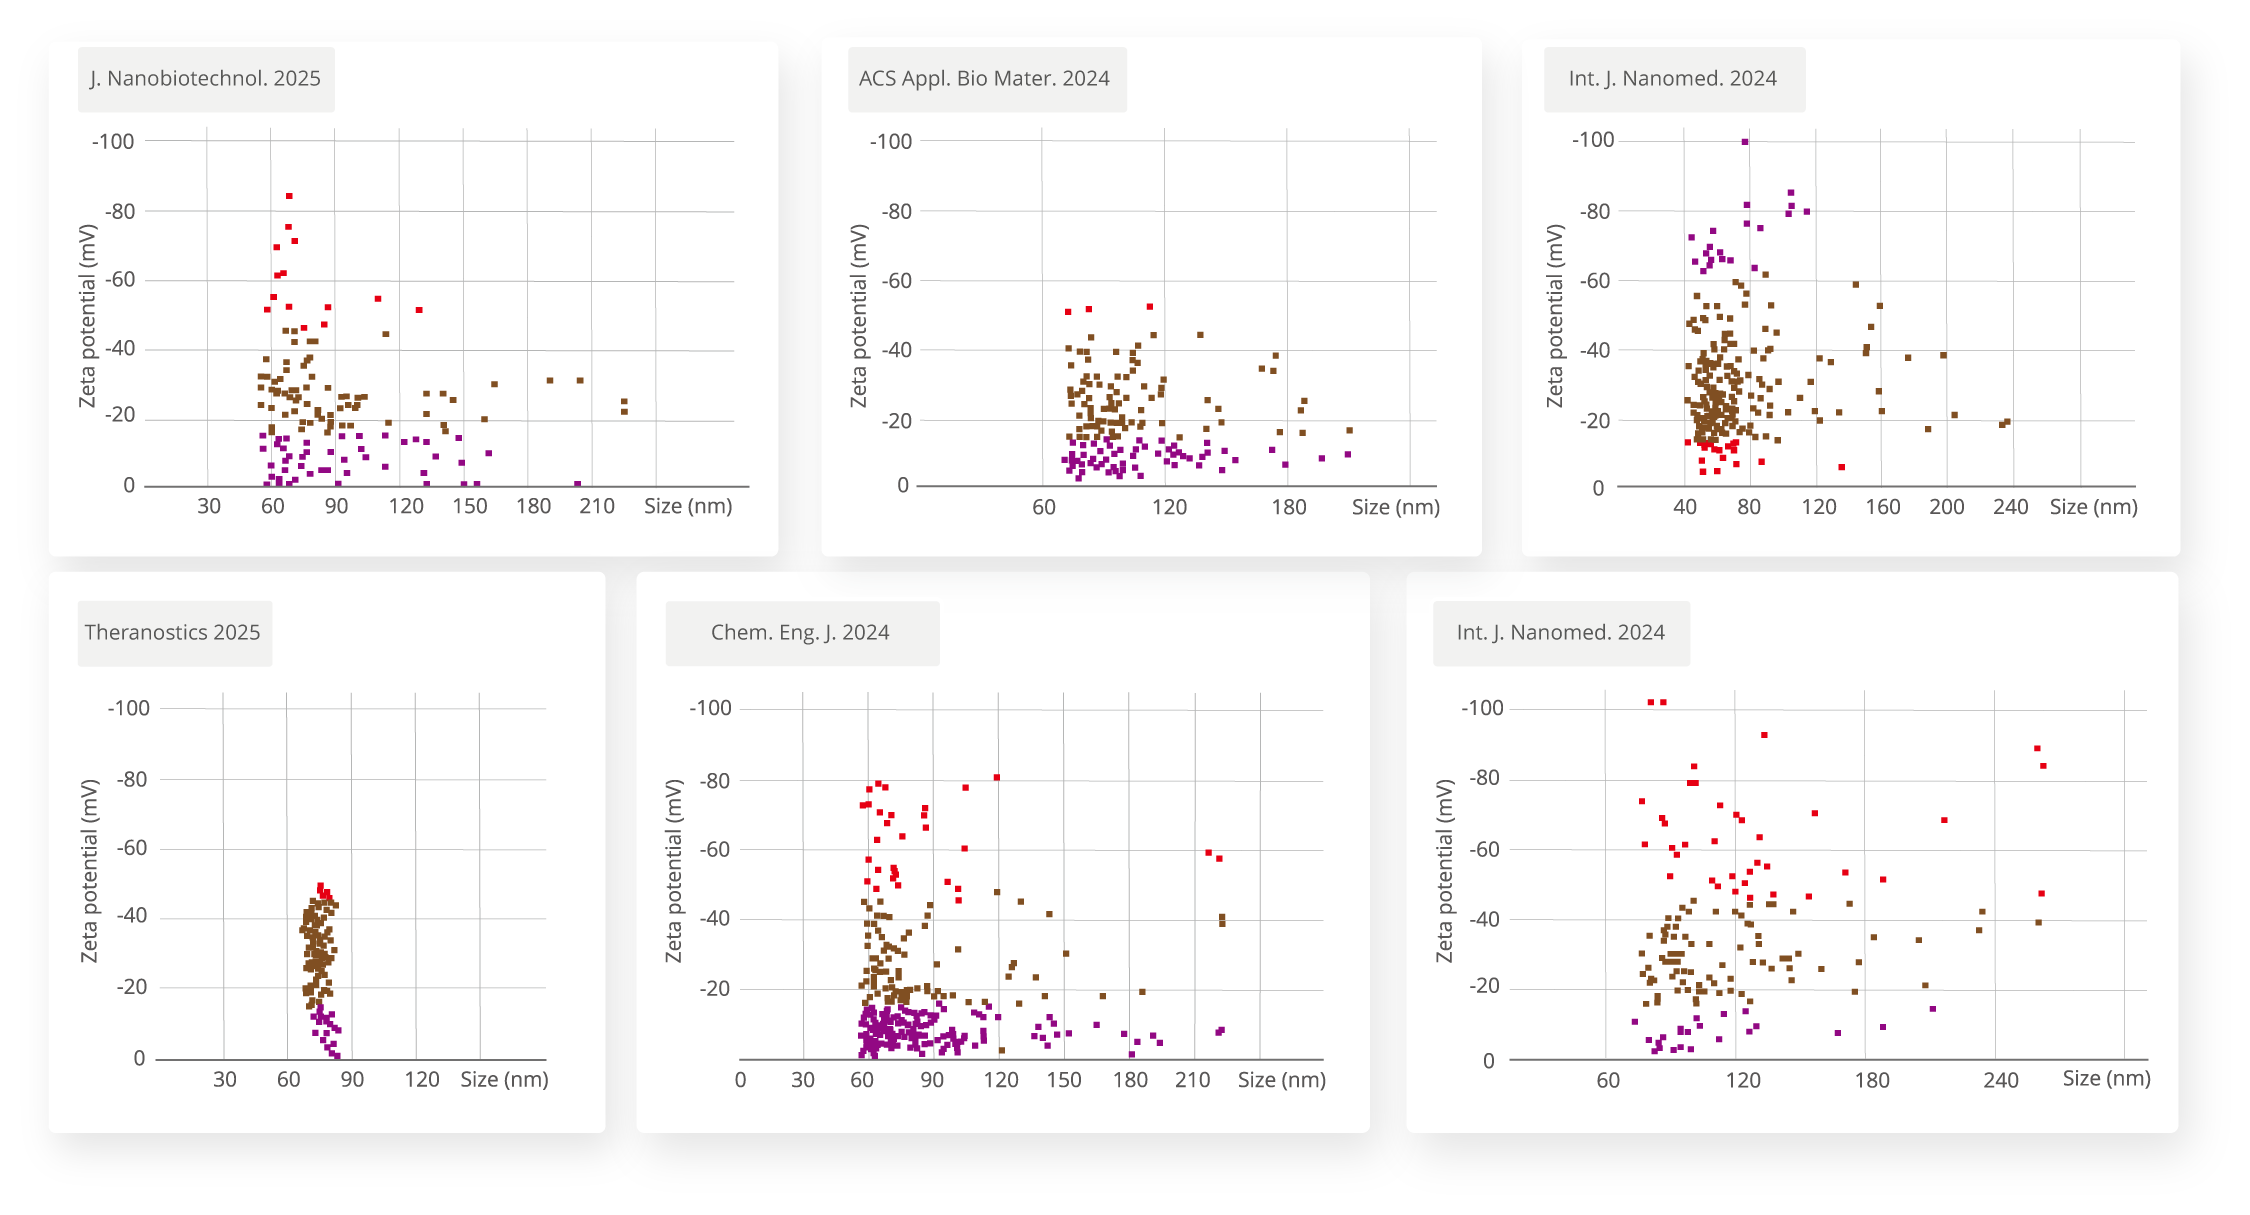
EV Zeta Potential Characterization
Zeta potential is a key parameter for evaluating EV stability, surface charge characteristics, and in vivo interactions. It directly influences adsorption, targeted delivery, and circulation time within biological systems. Traditional optical methods (DLS/LNT),can only provide an ensemble-averaged potential, failing to capture sample heterogeneity. NanoCoulter™ enables single-particle Zeta potential measurement, offering precise insights into EV population heterogeneity, thereby advancing research and applications in EV-based therapeutics.
Poxvirus Particle Aggregation Analysis
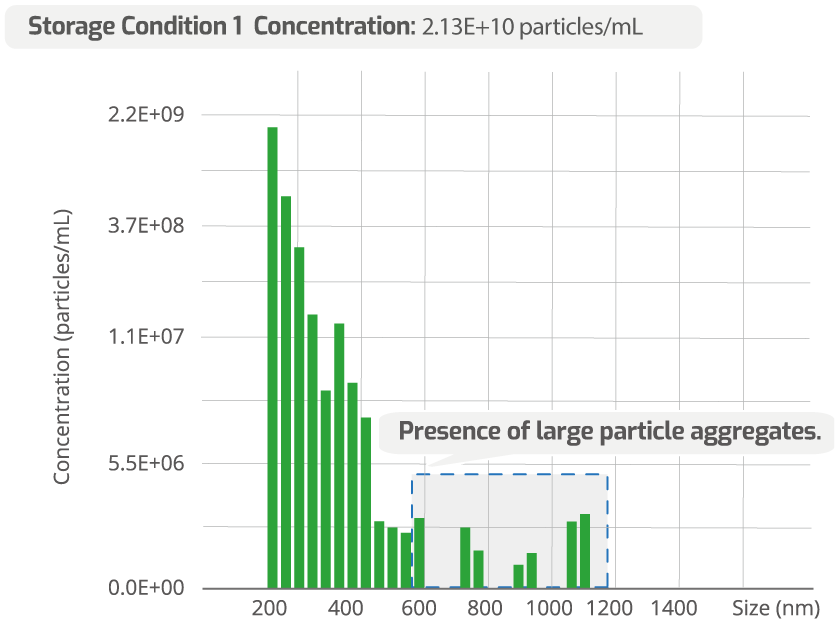
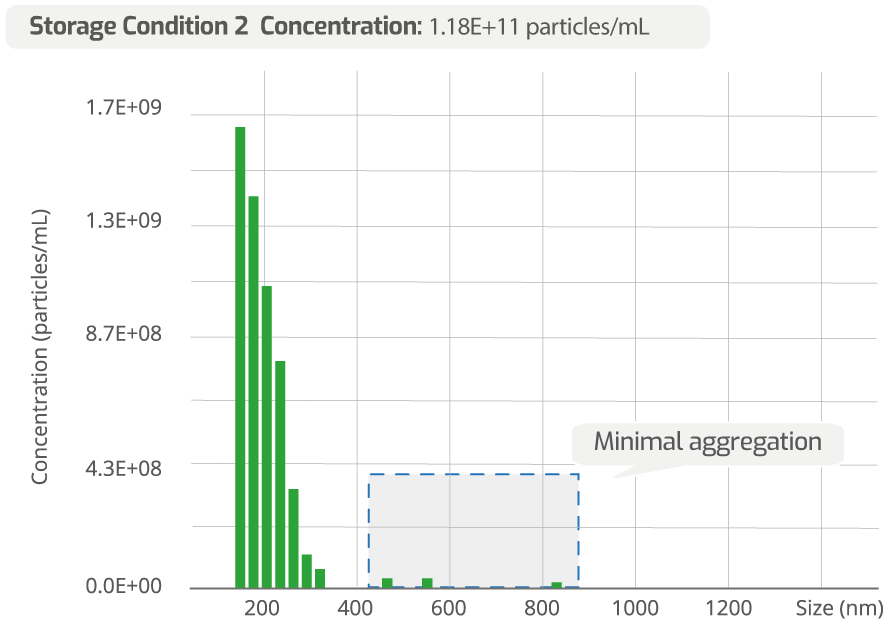
The storage conditions of viruses have a significant impact on their degree of aggregation. Excessive aggregation can reduce the infectivity of the virus. The NanoCoulterTM possesses extremely high particle size resolution and is the only technology besides electron microscopy capable of accurately analyzing virus aggregation. In the distribution plots of poxvirus particles under two different storage conditions shown below, the virus particles under Condition 2 exhibit significantly better dispersion.
Liposome Stability Study
The stability of liposomal drugs directly affects their storage and in vivo delivery performance. The NanoCoulter™ enables precise evaluation of stability differences among various liposomes. The figure below shows the concentration changes of two liposome samples after different durations of simulated agitation, indicating that Sample 2 exhibits superior stability.

Latest Articles & News